display flow chart on current graphics device
vis_model(
  params = read_params("PHAC_testify.csv"),
  testify = FALSE,
  ageify = FALSE,
  method = c("Matrix", "diagram", "igraph"),
  ...
)
Arguments
- params
parameters (flowchart is determined by non-zero flows)
- testify
add testing flows?
- ageify
add age structure?
- method
visualization method
- ...
parameters to pass to
show_ratemat
See also
Other classic_macpan:
add_d_log(),
add_updated_vaxrate(),
aggregate_agecats(),
calibrate_comb(),
calibrate(),
check_age_cat_compatibility(),
check_contact_rate_setting(),
col_multiply(),
condense_age(),
condense_params_vax(),
condense_state(),
condense_vax(),
dev_is_tikz(),
do_step(),
expand_params_age(),
expand_params_desc_age(),
expand_params_desc_variant(),
expand_params_desc_vax(),
expand_params_mistry(),
expand_params_variant(),
expand_params_vax(),
expand_state_age(),
expand_state_vax(),
expand_stateval_testing(),
fix_pars(),
fix_stored(),
forecast_ensemble(),
forecast_sim(),
getData(),
get_GI_moments(),
get_Gbar(),
get_R0(),
get_doses_per_day(),
get_evec(),
get_kernel_moments(),
get_opt_pars(),
get_r(),
invlink_trans(),
make_betavec(),
make_beta(),
make_jac(),
make_ratemat(),
make_state(),
make_test_wtsvec(),
make_vaxrate(),
mk_Nvec(),
mk_agecats(),
mk_contact_rate_setting(),
mk_mistry_Nvec(),
mk_pmat(),
mk_vaxcats(),
mle_fun(),
non_expanded_states,
rExp(),
read_params(),
repair_names_age(),
restore(),
run_sim_ageify(),
run_sim_break(),
run_sim_loglin(),
run_sim_mobility(),
run_sim_range(),
run_sim(),
show_ratemat(),
testify(),
texify(),
trans_state_vars(),
update_contact_rate_setting(),
update_foi(),
update_params_mistry(),
write_params()
Examples
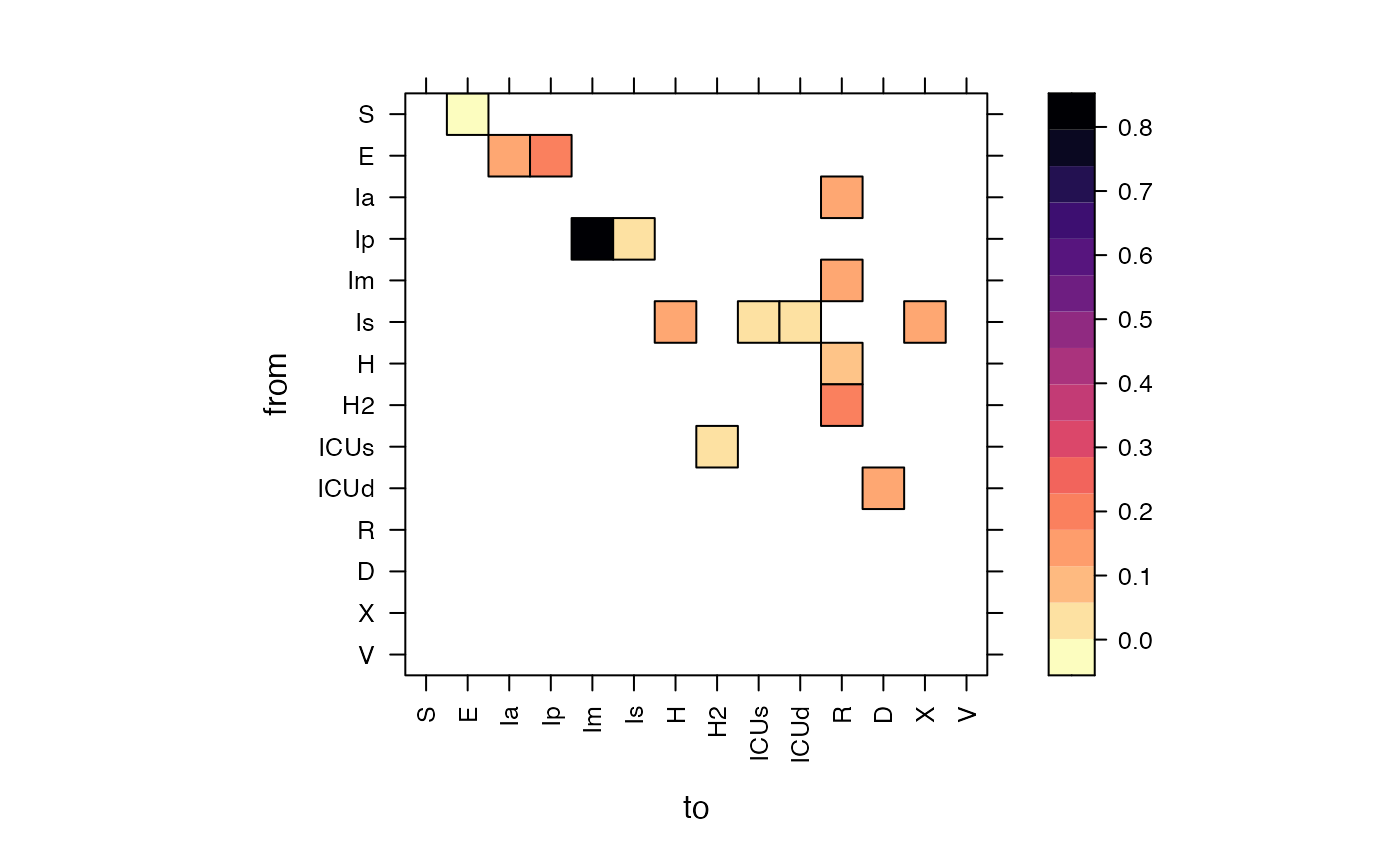
vis_model()
#> Warning: CHECK: may not be working properly for testify?
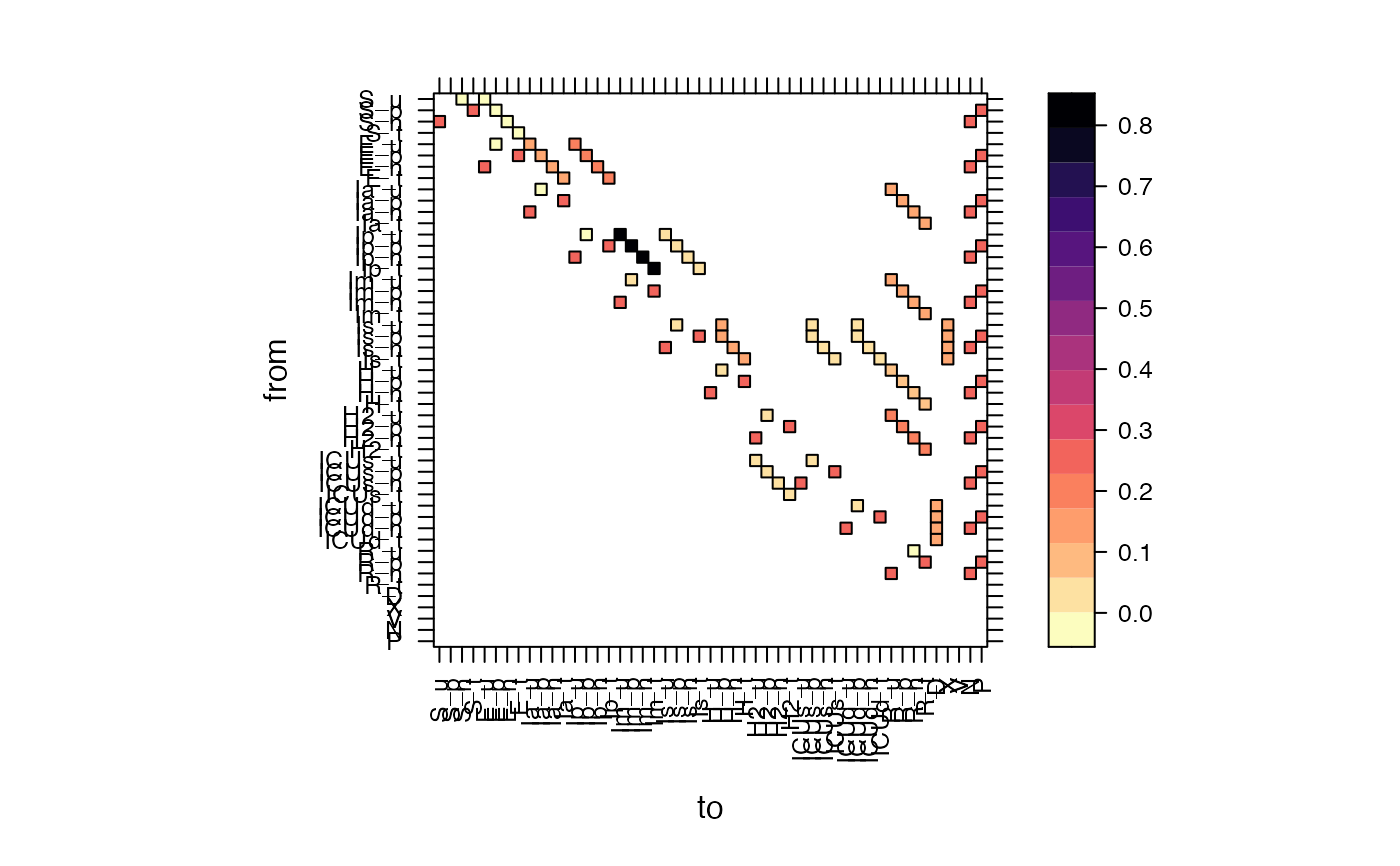
 vis_model(testify=TRUE)
#> Warning: CHECK: may not be working properly for testify?
vis_model(testify=TRUE)
#> Warning: CHECK: may not be working properly for testify?
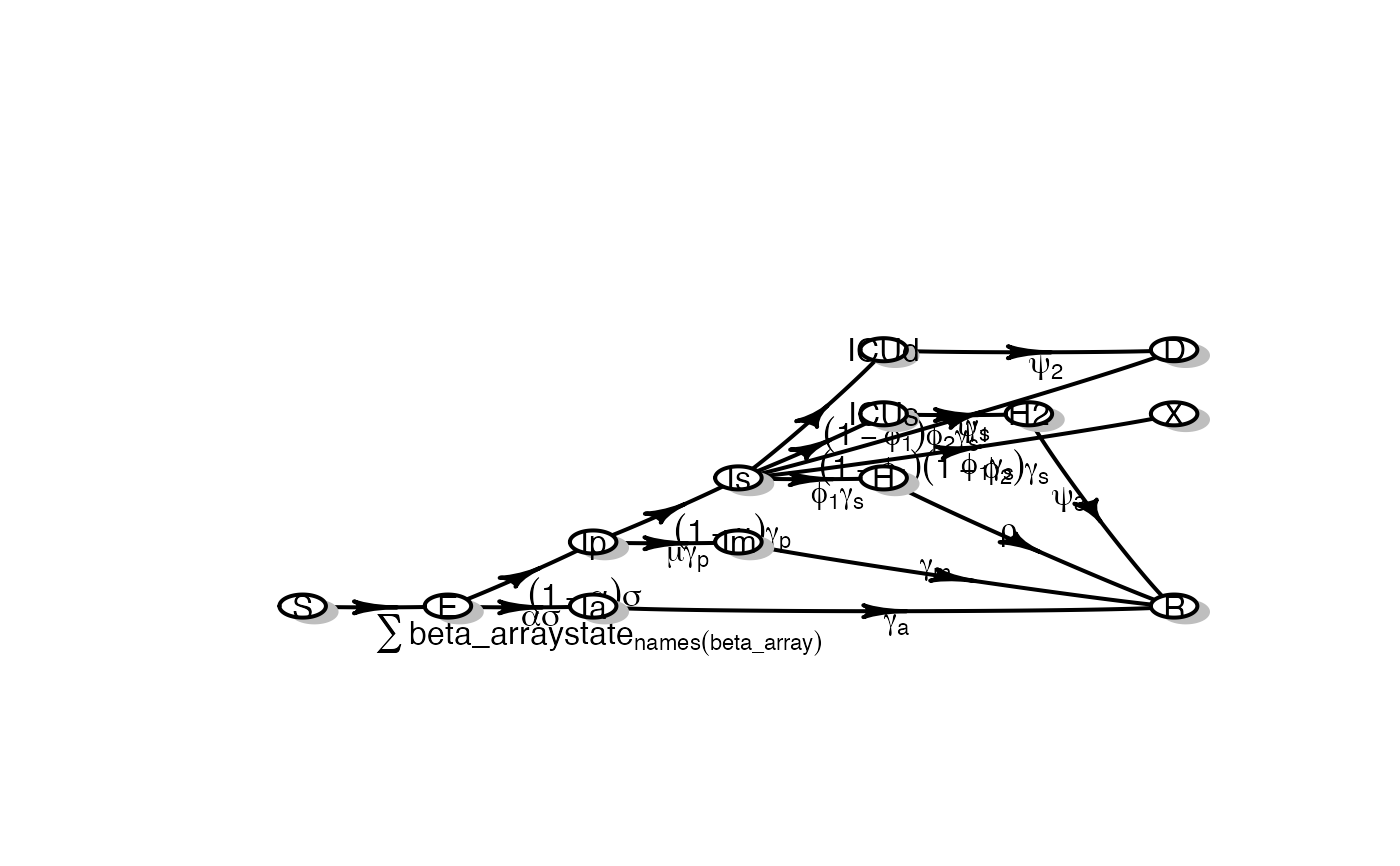
 vis_model(method="diagram")
#> Warning: CHECK: may not be working properly for testify?
vis_model(method="diagram")
#> Warning: CHECK: may not be working properly for testify?
 #> NULL