visualize rate (per-capita flow) matrix
show_ratemat(
  M,
  method = c("Matrix", "diagram", "igraph"),
  subset = NULL,
  xlab = "to",
  ylab = "from",
  sub = "",
  zlim = c(0, 1),
  aspect = "iso",
  block_size = NULL,
  block_col = 2,
  axlabs = TRUE,
  const_width = (method == "igraph"),
  colour_palette = viridis::magma(n = 50, direction = -1),
  do_symbols = NULL,
  box.size = 0.02,
  ...
)
Arguments
- M
rate matrix
- method
visualization method
- subset
list of two regular expressions, the first to subset rate matrix rows (based on rownames) and the second to subset columns (based on colnames)
- xlab
label on x axis
- ylab
label on y axis
- sub
subtitle for plot
- zlim
appears to be unused (!!)
- aspect
aspect ratio ("iso", "fill" are the sensible options)
- block_size
numeric vector of number of compartments per block; if NA, try to guess from number of epidemiological compartments
- block_col
each element in block_col controls the color of the corresponding grid overlay added by block_size (if add_blocks==TRUE)
- axlabs
for flow matrices, show axis tick labels?
- const_width
set flows to constant value of 1?
- colour_palette
vector of colours for rate matrix heatmap
- do_symbols
plot symbolic values for flows?
- box.size
box size for diagram
- ...
arguments to pass to lower level functions (plotmat::diagram/image/igraph)
See also
Other classic_macpan:
add_d_log(),
add_updated_vaxrate(),
aggregate_agecats(),
calibrate_comb(),
calibrate(),
check_age_cat_compatibility(),
check_contact_rate_setting(),
col_multiply(),
condense_age(),
condense_params_vax(),
condense_state(),
condense_vax(),
dev_is_tikz(),
do_step(),
expand_params_age(),
expand_params_desc_age(),
expand_params_desc_variant(),
expand_params_desc_vax(),
expand_params_mistry(),
expand_params_variant(),
expand_params_vax(),
expand_state_age(),
expand_state_vax(),
expand_stateval_testing(),
fix_pars(),
fix_stored(),
forecast_ensemble(),
forecast_sim(),
getData(),
get_GI_moments(),
get_Gbar(),
get_R0(),
get_doses_per_day(),
get_evec(),
get_kernel_moments(),
get_opt_pars(),
get_r(),
invlink_trans(),
make_betavec(),
make_beta(),
make_jac(),
make_ratemat(),
make_state(),
make_test_wtsvec(),
make_vaxrate(),
mk_Nvec(),
mk_agecats(),
mk_contact_rate_setting(),
mk_mistry_Nvec(),
mk_pmat(),
mk_vaxcats(),
mle_fun(),
non_expanded_states,
rExp(),
read_params(),
repair_names_age(),
restore(),
run_sim_ageify(),
run_sim_break(),
run_sim_loglin(),
run_sim_mobility(),
run_sim_range(),
run_sim(),
testify(),
texify(),
trans_state_vars(),
update_contact_rate_setting(),
update_foi(),
update_params_mistry(),
vis_model(),
write_params()
Examples
params <- read_params("ICU1.csv")
state <- make_state(params[["N"]],E0=params[["E0"]], use_eigvec=FALSE)
M <- make_ratemat(state, params)
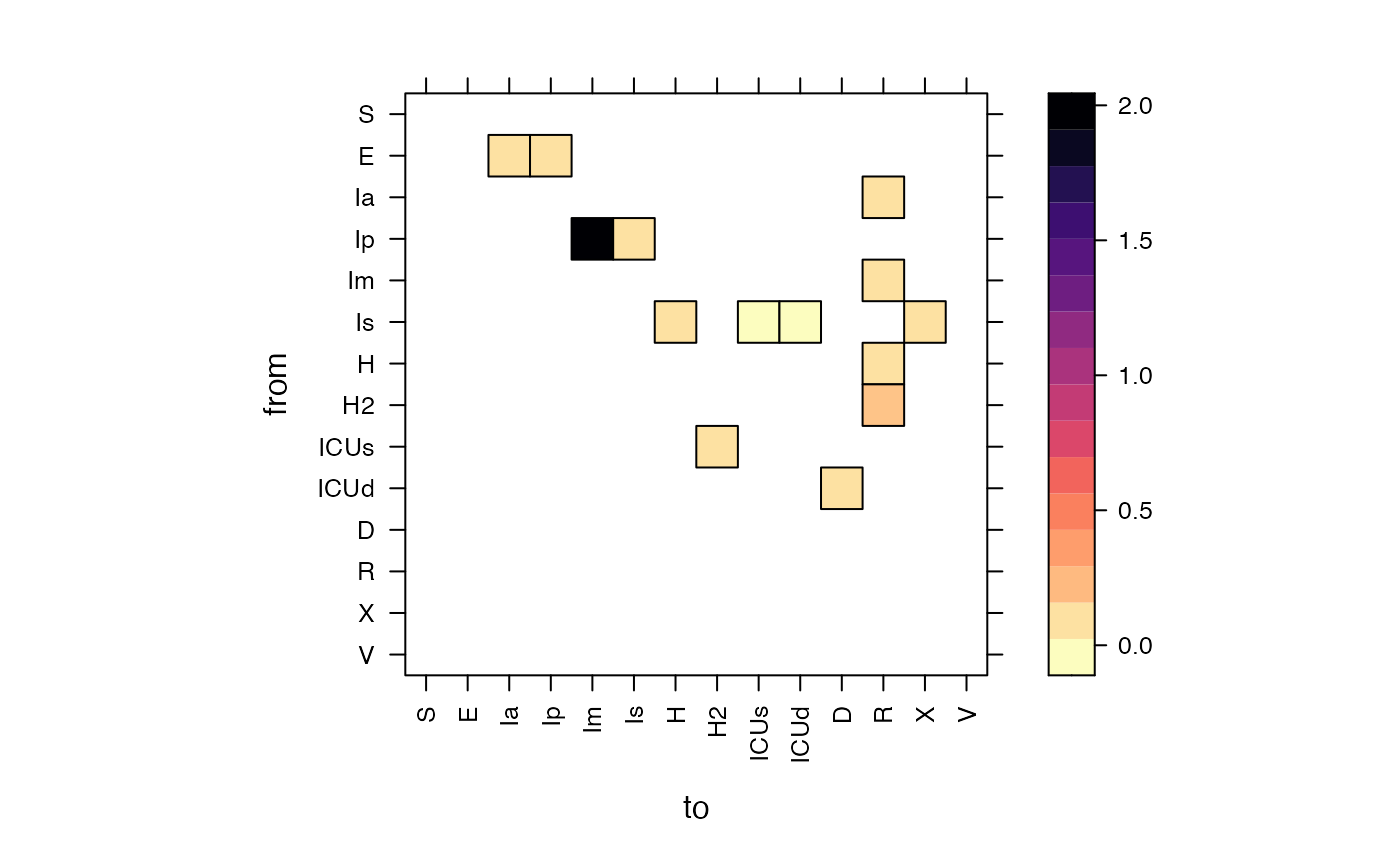
show_ratemat(M)
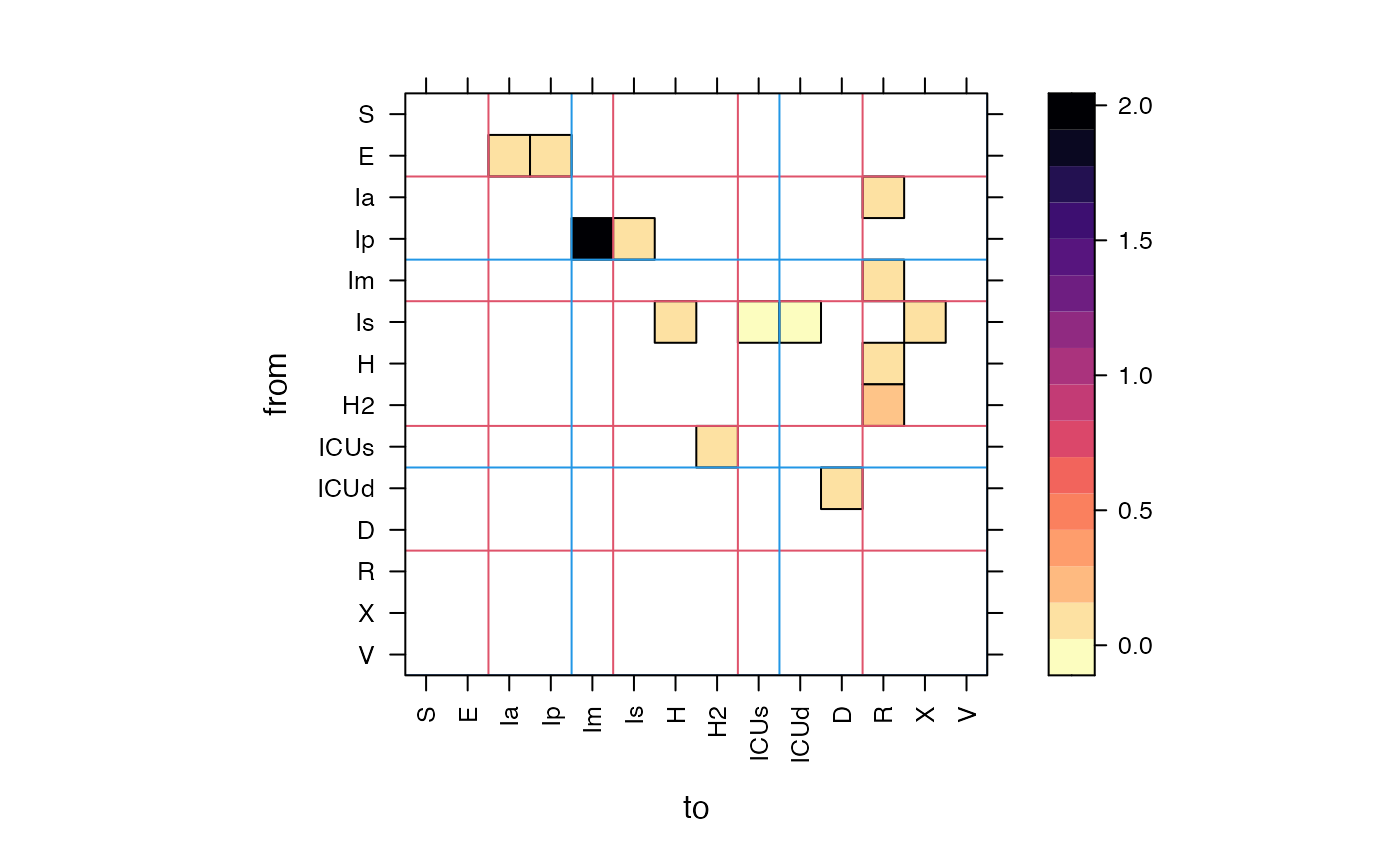
 ## silly but shows we can do multiple block types in different colours
show_ratemat(M, block_size=c(3,5), block_col=c(2,4))
#> Loading required namespace: latticeExtra
## silly but shows we can do multiple block types in different colours
show_ratemat(M, block_size=c(3,5), block_col=c(2,4))
#> Loading required namespace: latticeExtra