Run simulation across a range of times
run_sim_range(
  params,
  state = make_state(params[["N"]], params[["E0"]]),
  nt = 100,
  dt = 1,
  M = NULL,
  ratemat_args = NULL,
  step_args = NULL,
  use_ode = FALSE,
  ode_args = list()
)
Arguments
- params
named vector of parameters
- state
named vector of states
- nt
number of steps to take
- dt
time step (days)
- M
rate matrix
- ratemat_args
additional arguments to pass to
make_ratemat- step_args
additional arguments to pass to
do_step- use_ode
solve as differential equation?
- ode_args
additional arguments to ode()
See also
Other classic_macpan:
add_d_log(),
add_updated_vaxrate(),
aggregate_agecats(),
calibrate_comb(),
calibrate(),
check_age_cat_compatibility(),
check_contact_rate_setting(),
col_multiply(),
condense_age(),
condense_params_vax(),
condense_state(),
condense_vax(),
dev_is_tikz(),
do_step(),
expand_params_age(),
expand_params_desc_age(),
expand_params_desc_variant(),
expand_params_desc_vax(),
expand_params_mistry(),
expand_params_variant(),
expand_params_vax(),
expand_state_age(),
expand_state_vax(),
expand_stateval_testing(),
fix_pars(),
fix_stored(),
forecast_ensemble(),
forecast_sim(),
getData(),
get_GI_moments(),
get_Gbar(),
get_R0(),
get_doses_per_day(),
get_evec(),
get_kernel_moments(),
get_opt_pars(),
get_r(),
invlink_trans(),
make_betavec(),
make_beta(),
make_jac(),
make_ratemat(),
make_state(),
make_test_wtsvec(),
make_vaxrate(),
mk_Nvec(),
mk_agecats(),
mk_contact_rate_setting(),
mk_mistry_Nvec(),
mk_pmat(),
mk_vaxcats(),
mle_fun(),
non_expanded_states,
rExp(),
read_params(),
repair_names_age(),
restore(),
run_sim_ageify(),
run_sim_break(),
run_sim_loglin(),
run_sim_mobility(),
run_sim(),
show_ratemat(),
testify(),
texify(),
trans_state_vars(),
update_contact_rate_setting(),
update_foi(),
update_params_mistry(),
vis_model(),
write_params()
Examples
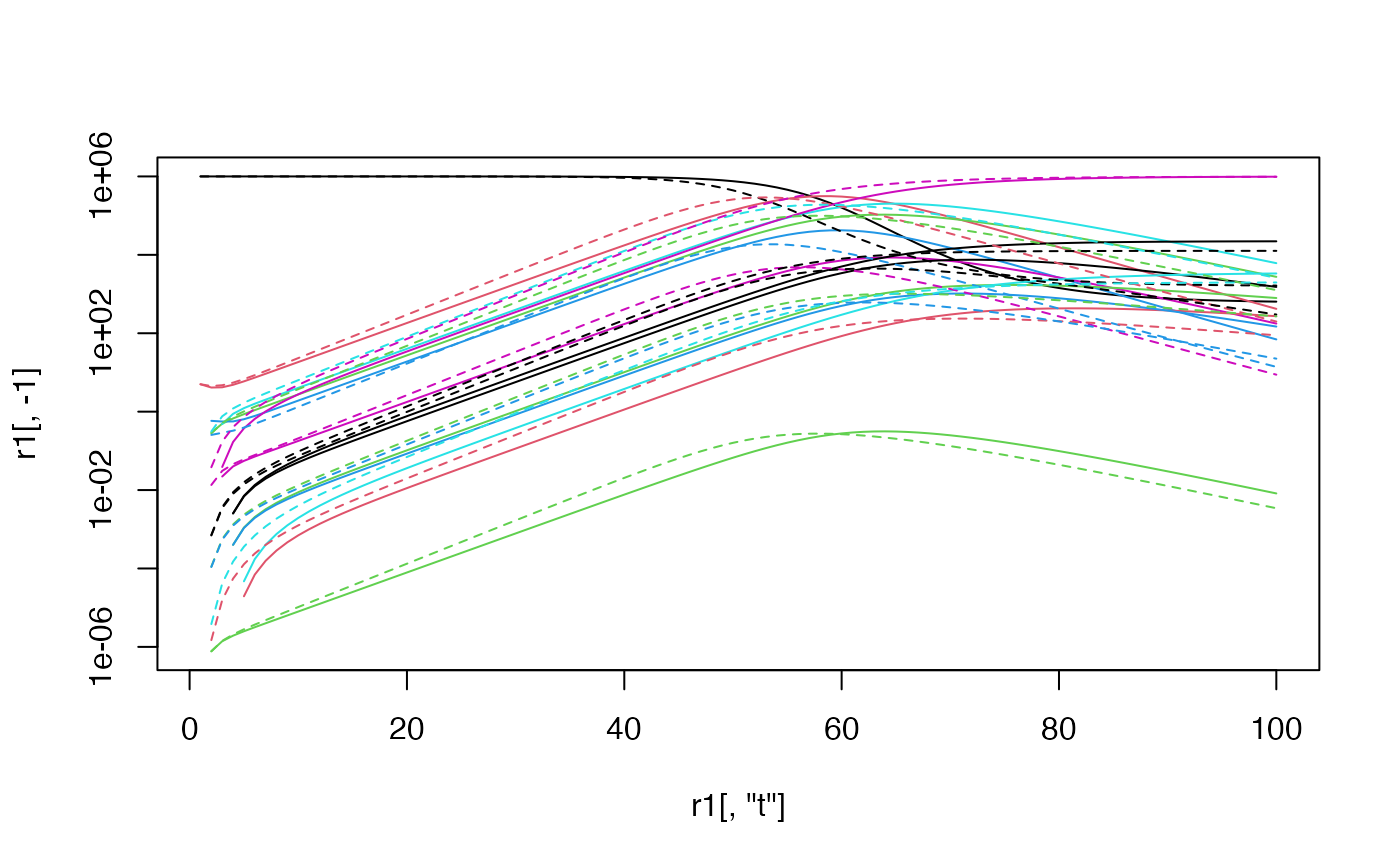
params <- read_params("ICU1.csv")
r1 <- run_sim_range(params)
r2 <- run_sim_range(params,use_ode=TRUE)
matplot(r1[,"t"],r1[,-1],type="l",lty=1,log="y")
#> Warning: 129 y values <= 0 omitted from logarithmic plot
matlines(r2[,"t"],r2[,-1],lty=2)