plot forecasts from fits
# S3 method for predict_pansim
plot(
  x,
  data = NULL,
  break_dates = NULL,
  dlspace = 1,
  limspace = 10,
  add_tests = FALSE,
  add_ICU_cap = FALSE,
  mult_var = NULL,
  directlabels = TRUE,
  log = TRUE,
  log_lwr = 1,
  ...
)
Arguments
- x
a calibrated object (result from
calibrate) or a prediction (frompredict.fit_pansim)- data
original time series data
- break_dates
breakpoints
- dlspace
spacing for direct labels (not working)
- limspace
extra space (in days) to add to make room for direct labels
- add_tests
plot newTests/1000?
- add_ICU_cap
include horizontal lines showing ICU capacity?
- mult_var
variable in data set indicating multiple forecast types to compare
- directlabels
use direct labels?
- log
use a log10 scale for the y axis?
- log_lwr
lower limit when using log scale
- ...
extra arguments (unused)
Examples
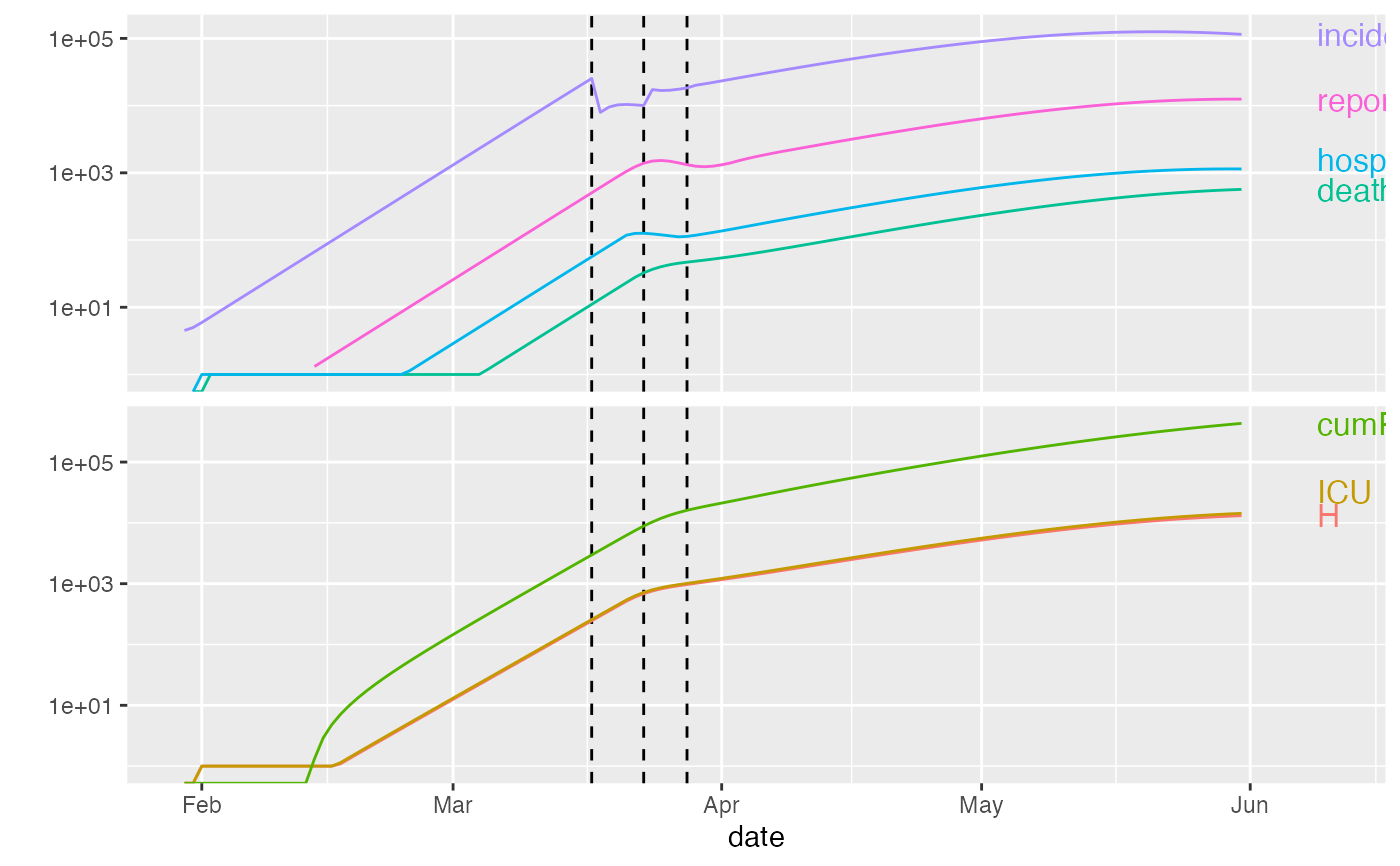
plot(ont_cal1)
#> Warning: specifying params_timevar with Relative_value is deprecated: auto-converting (reported once per session)
#> Loading required namespace: directlabels
#> Warning: Transformation introduced infinite values in continuous y-axis
#> Warning: Transformation introduced infinite values in continuous y-axis
#> Warning: Removed 17 row(s) containing missing values (geom_path).
#> Warning: Removed 17 rows containing missing values (geom_dl).
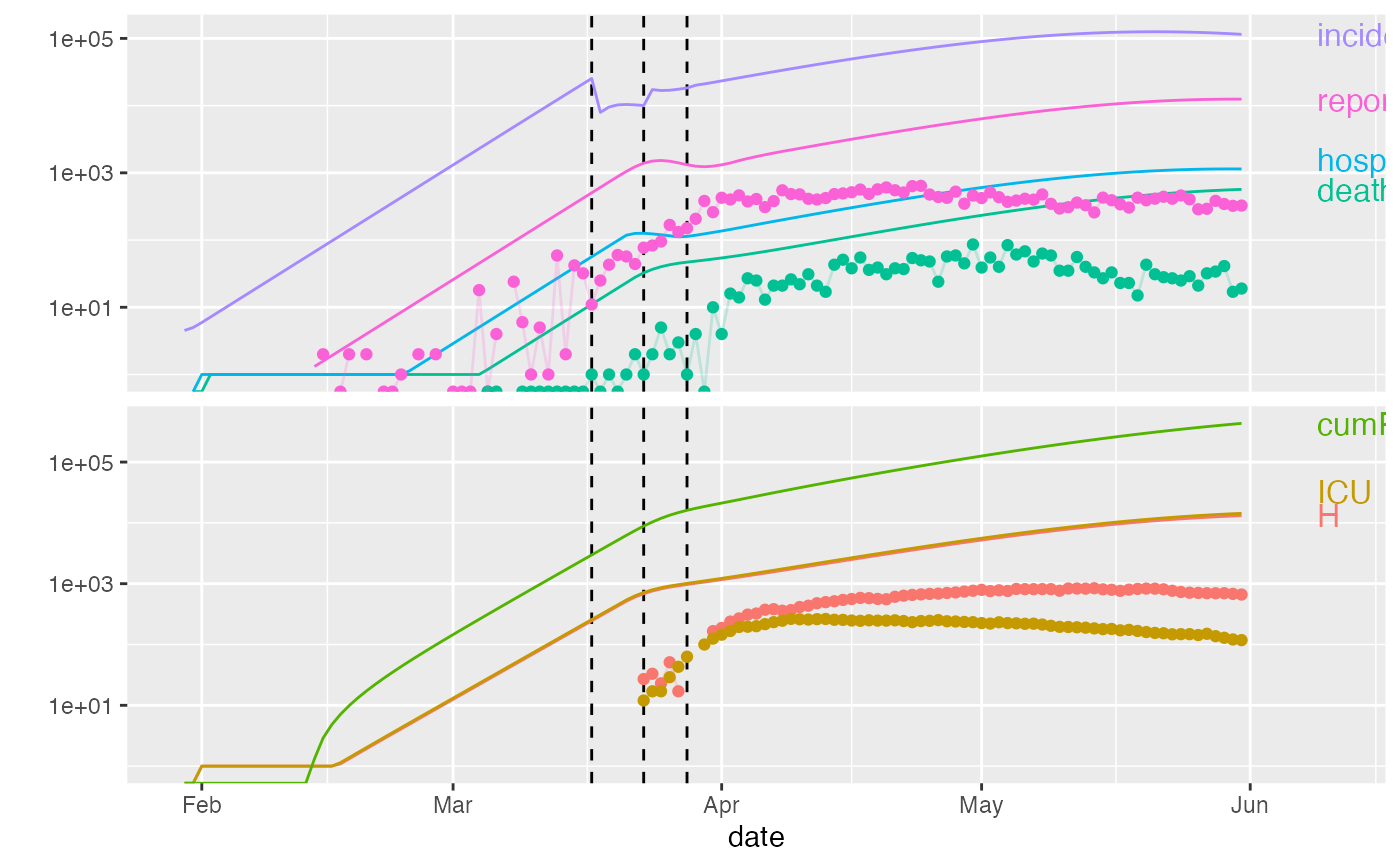
 ont_trans <- trans_state_vars(ont_all)
plot(ont_cal1,data=ont_trans)
#> Warning: specifying params_timevar with Relative_value is deprecated: auto-converting (reported once per session)
#> Warning: Transformation introduced infinite values in continuous y-axis
#> Warning: Transformation introduced infinite values in continuous y-axis
#> Warning: Transformation introduced infinite values in continuous y-axis
#> Warning: Transformation introduced infinite values in continuous y-axis
#> Warning: Removed 17 row(s) containing missing values (geom_path).
#> Warning: Removed 110 rows containing missing values (geom_point).
#> Warning: Removed 97 row(s) containing missing values (geom_path).
#> Warning: Removed 17 rows containing missing values (geom_dl).
ont_trans <- trans_state_vars(ont_all)
plot(ont_cal1,data=ont_trans)
#> Warning: specifying params_timevar with Relative_value is deprecated: auto-converting (reported once per session)
#> Warning: Transformation introduced infinite values in continuous y-axis
#> Warning: Transformation introduced infinite values in continuous y-axis
#> Warning: Transformation introduced infinite values in continuous y-axis
#> Warning: Transformation introduced infinite values in continuous y-axis
#> Warning: Removed 17 row(s) containing missing values (geom_path).
#> Warning: Removed 110 rows containing missing values (geom_point).
#> Warning: Removed 97 row(s) containing missing values (geom_path).
#> Warning: Removed 17 rows containing missing values (geom_dl).
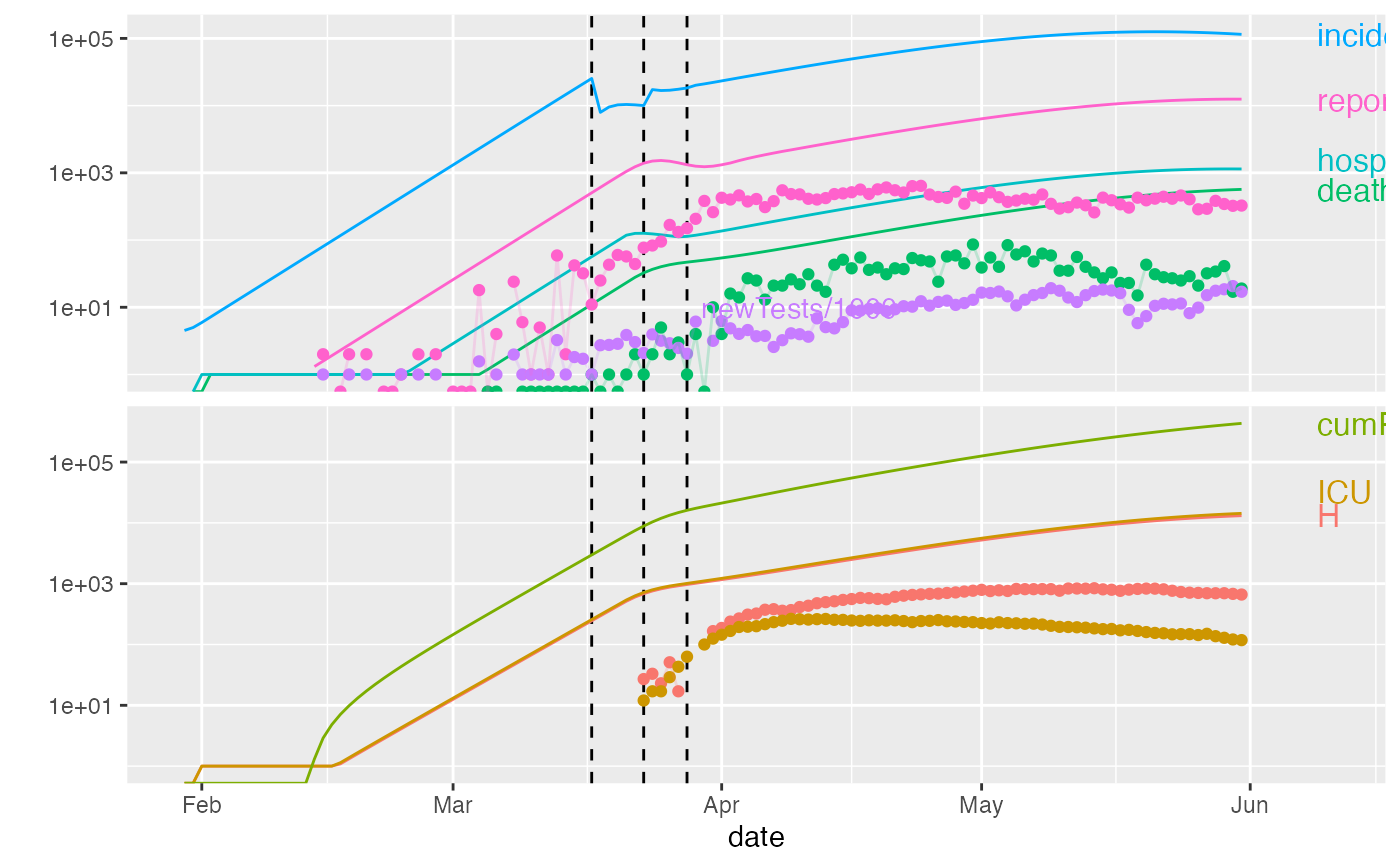
 plot(ont_cal1,data=ont_trans, add_tests=TRUE)
#> Warning: specifying params_timevar with Relative_value is deprecated: auto-converting (reported once per session)
#> Warning: Transformation introduced infinite values in continuous y-axis
#> Warning: Transformation introduced infinite values in continuous y-axis
#> Warning: Transformation introduced infinite values in continuous y-axis
#> Warning: Transformation introduced infinite values in continuous y-axis
#> Warning: Removed 17 row(s) containing missing values (geom_path).
#> Warning: Removed 126 rows containing missing values (geom_point).
#> Warning: Removed 98 row(s) containing missing values (geom_path).
#> Warning: Removed 17 rows containing missing values (geom_dl).
plot(ont_cal1,data=ont_trans, add_tests=TRUE)
#> Warning: specifying params_timevar with Relative_value is deprecated: auto-converting (reported once per session)
#> Warning: Transformation introduced infinite values in continuous y-axis
#> Warning: Transformation introduced infinite values in continuous y-axis
#> Warning: Transformation introduced infinite values in continuous y-axis
#> Warning: Transformation introduced infinite values in continuous y-axis
#> Warning: Removed 17 row(s) containing missing values (geom_path).
#> Warning: Removed 126 rows containing missing values (geom_point).
#> Warning: Removed 98 row(s) containing missing values (geom_path).
#> Warning: Removed 17 rows containing missing values (geom_dl).
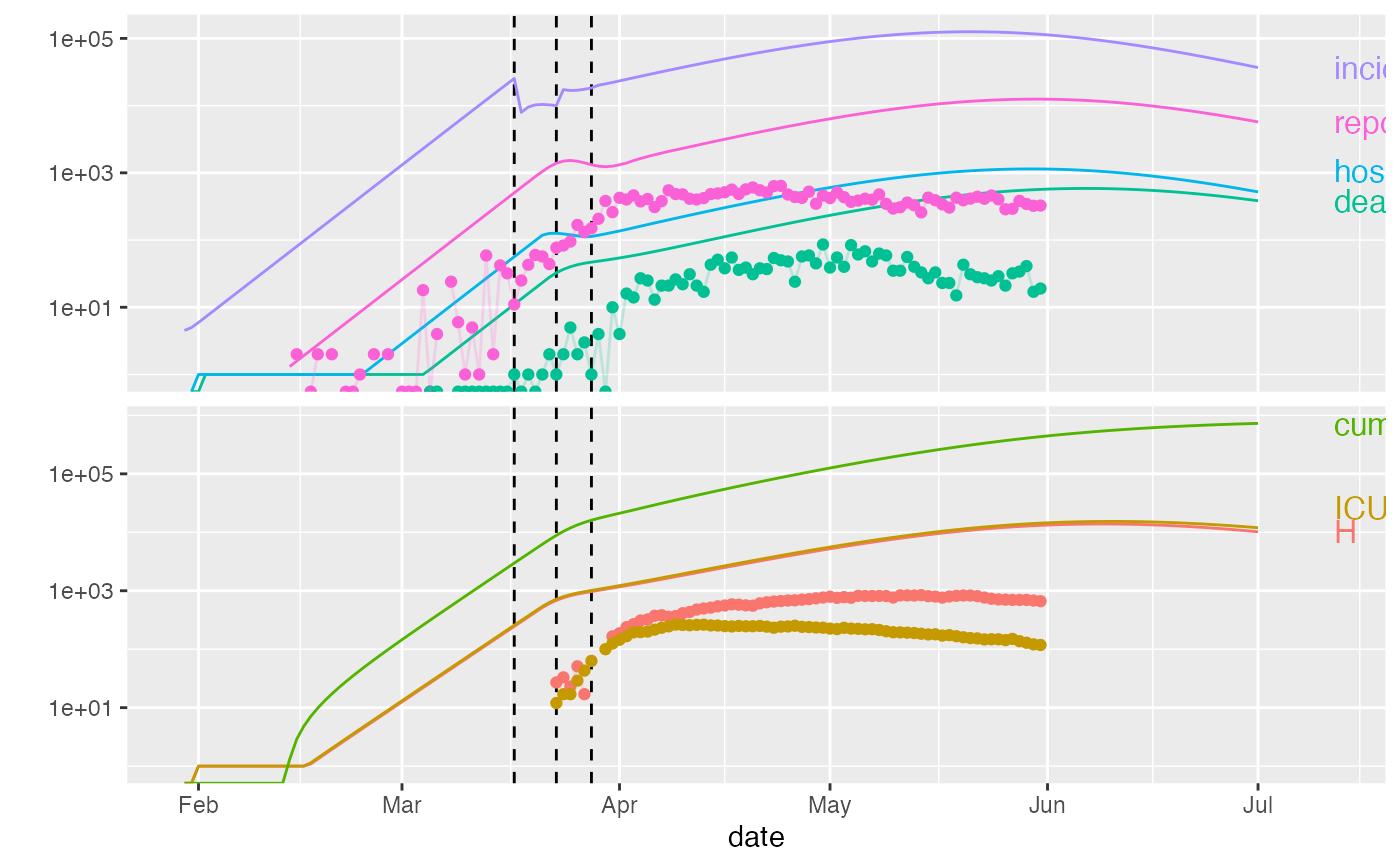
 plot(ont_cal1,data=ont_trans, predict_args=list(end_date="2020-07-01"))
#> Warning: specifying params_timevar with Relative_value is deprecated: auto-converting (reported once per session)
#> Warning: Transformation introduced infinite values in continuous y-axis
#> Warning: Transformation introduced infinite values in continuous y-axis
#> Warning: Transformation introduced infinite values in continuous y-axis
#> Warning: Transformation introduced infinite values in continuous y-axis
#> Warning: Removed 17 row(s) containing missing values (geom_path).
#> Warning: Removed 110 rows containing missing values (geom_point).
#> Warning: Removed 97 row(s) containing missing values (geom_path).
#> Warning: Removed 17 rows containing missing values (geom_dl).
plot(ont_cal1,data=ont_trans, predict_args=list(end_date="2020-07-01"))
#> Warning: specifying params_timevar with Relative_value is deprecated: auto-converting (reported once per session)
#> Warning: Transformation introduced infinite values in continuous y-axis
#> Warning: Transformation introduced infinite values in continuous y-axis
#> Warning: Transformation introduced infinite values in continuous y-axis
#> Warning: Transformation introduced infinite values in continuous y-axis
#> Warning: Removed 17 row(s) containing missing values (geom_path).
#> Warning: Removed 110 rows containing missing values (geom_point).
#> Warning: Removed 97 row(s) containing missing values (geom_path).
#> Warning: Removed 17 rows containing missing values (geom_dl).
 # \donttest{
## FIXME: don't try these until we have an example where ensemble works
## pp <- predict(ont_cal_2brks, ensemble=TRUE)
## plot(pp)
## plot(pp, data=ont_trans)
# }
# \donttest{
## FIXME: don't try these until we have an example where ensemble works
## pp <- predict(ont_cal_2brks, ensemble=TRUE)
## plot(pp)
## plot(pp, data=ont_trans)
# }