make forecasts from sim
# S3 method for fit_pansim
predict(
  object,
  end_date = NULL,
  stoch = NULL,
  stoch_start = NULL,
  keep_vars = c("H", "ICU", "death", "hosp", "incidence", "report", "cumRep",
    "newTests/1000"),
  ensemble = FALSE,
  new_params = NULL,
  Sigma = NULL,
  scale_Sigma = 1,
  ...
)

# S3 method for fit_pansim
plot(
  x,
  predict_args = NULL,
  data = NULL,
  break_dates = NULL,
  dlspace = 1,
  limspace = 10,
  add_tests = FALSE,
  add_ICU_cap = FALSE,
  mult_var = NULL,
  directlabels = TRUE,
  log = TRUE,
  log_lwr = 1,
  ...
)
Arguments
- object
a fitted object
- end_date
ending date for sim
- stoch
stochasticity
- stoch_start
stoch starting date
- keep_vars
...
- ensemble
run ensemble?
- new_params
parameters to update in base parameters (e.g. adding stochastic parameters)
- Sigma
covariance matrix
- scale_Sigma
inflate/deflate covariance matrix
- ...
extra args (passed to forecast_ensemble)
- x
a calibrated object (result from
calibrate) or a prediction (frompredict.fit_pansim)- predict_args
additional arguments to pass to predict
- data
original time series data
- break_dates
breakpoints
- dlspace
spacing for direct labels (not working)
- limspace
extra space (in days) to add to make room for direct labels
- add_tests
plot newTests/1000?
- add_ICU_cap
include horizontal lines showing ICU capacity?
- mult_var
variable in data set indicating multiple forecast types to compare
- directlabels
use direct labels?
- log
use a log10 scale for the y axis?
- log_lwr
lower limit when using log scale
Examples
pp1 <- predict(ont_cal1, keep_vars="Rt")
#> Warning: specifying params_timevar with Relative_value is deprecated: auto-converting (reported once per session)
## example of hacking params
ont_cal2 <- ont_cal1
ont_cal2$forecast_args$base_params["zeta"] <- 4
pp2 <- predict(ont_cal2, keep_vars="Rt")
#> Warning: specifying params_timevar with Relative_value is deprecated: auto-converting (reported once per session)
## if zeta is fitted probably need to hack x$mle2@coef, e.g.
ont_cal3 <- ont_cal1
## increase beta0 (from -0.34) rather than
## mess with zeta, since phenom het isn't
## estimated in this fit
ont_cal3$mle2@fullcoef["params.log_beta0"] <- 0
pp3 <- predict(ont_cal3, keep_vars="Rt")
#> Warning: specifying params_timevar with Relative_value is deprecated: auto-converting (reported once per session)
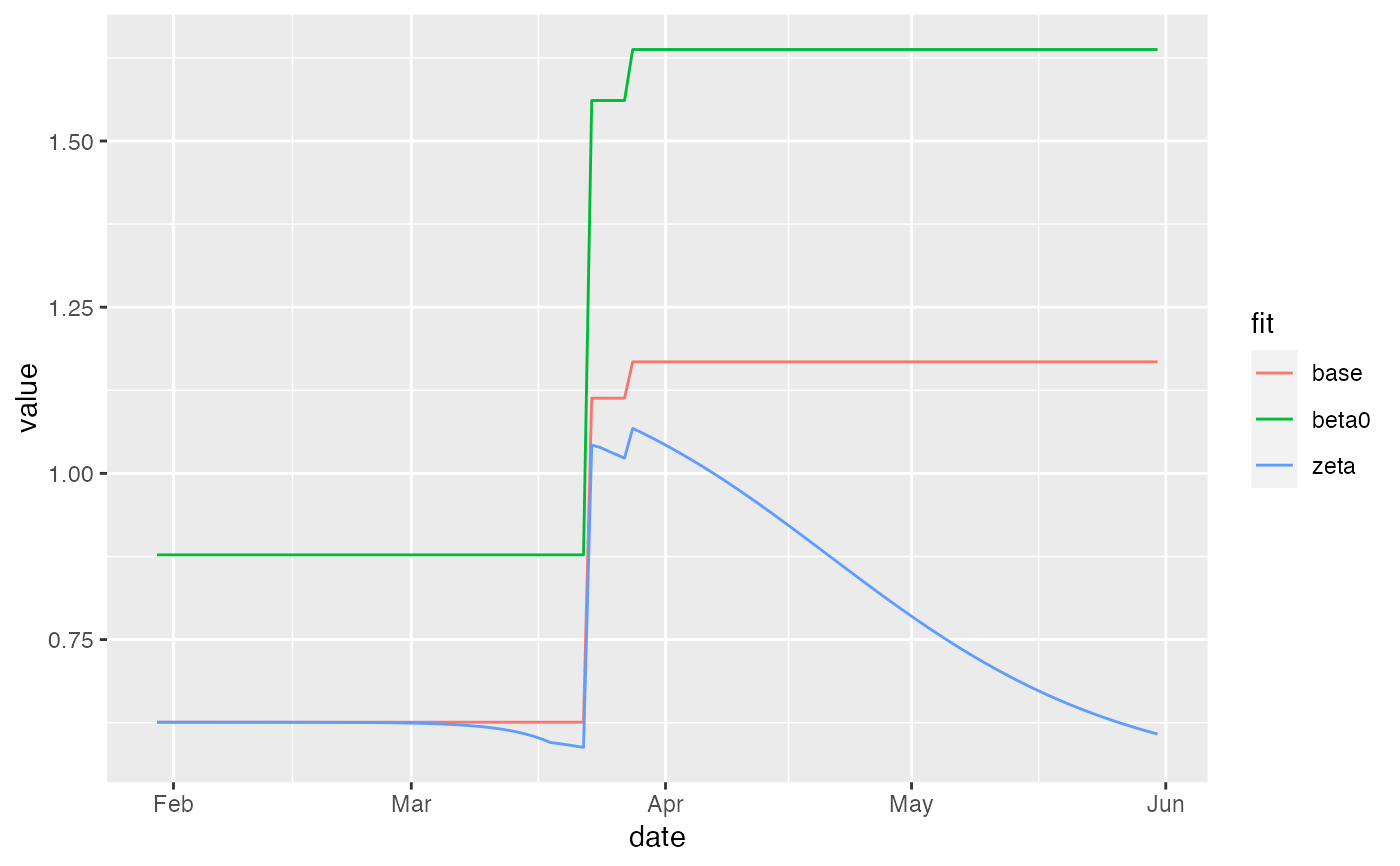
pp <- dplyr::bind_rows(base=pp1,zeta=pp2,beta0=pp3, .id="fit")
if (require("ggplot2")) {
ggplot(pp,aes(date,value,colour=fit))+geom_line()
}
#> Loading required package: ggplot2
#>
#> Attaching package: ‘ggplot2’
#> The following object is masked from ‘package:McMasterPandemic’:
#>
#> %+%
 if (FALSE) {
## non-pos-def vcov ... ???
predict(ont_cal_2brks,ensemble=TRUE)
}
if (FALSE) {
## non-pos-def vcov ... ???
predict(ont_cal_2brks,ensemble=TRUE)
}